– October 15, 2024 –
This One Chart Says It All…
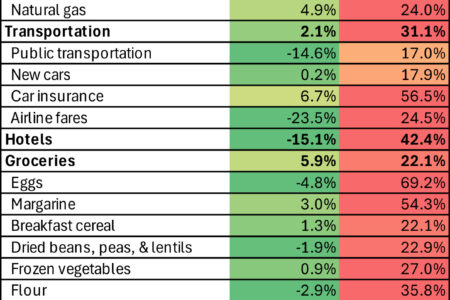
Prices are STILL rising, with overall prices up 20.5%, electricity up 31.3%, rent up 22.9%, and groceries up 22.1% since Kamala took office.
This chart says it all:

Kamala’s economy vs. President Trump’s economy:
- Under Kamala, inflation has averaged 5.2% — almost three times the average inflation rate under President Trump.
- Under Kamala, real average weekly earnings are down 3.4%. Under President Trump, real average weekly earnings increased 8.2%.
- Under Kamala, gas prices have averaged $3.49/gallon. Under President Trump, gas prices averaged $2.48/gallon.
- In Kamala’s first three years, Americans saw a 1.3% increase ($1,050) in median household income. In President Trump’s first three years, Americans saw a 10.5% boost ($7,690) in median household income — seven times larger.
- In Kamala’s first three years, the personal savings rate fell from 19.3% in 2021 to 2.9% in 2024 — an 85% decrease. In President Trump’s first three years, the personal savings rate rose from 5.3% in 2017 to 19.3% in 2021 — a 264% increase.
- Under Kamala, the average 30-year fixed mortgage rate increased by 120% between 2021 and 2024. Under President Trump, the average 30-year fixed mortgage rate decreased by 32% between 2017 and 2021.
- Under Kamala, credit card delinquency skyrocketed by 54% between 2020 and 2024. Under President Trump, credit card delinquency fell by 11% between 2016 and 2020.
Kamala’s inflationary policies sent prices soaring in the first place — and she’d double down if she’s elected in November with the largest tax hike in history, a Soviet-style price control scheme, and a housing plan that will only drive home prices higher.
The only way back to economic prosperity and opportunity for all Americans is by re-electing President Donald J. Trump in November.